
Sentry相关链接
SpringBoot文档:https://docs.sentry.io/platforms/java/guides/spring-boot/
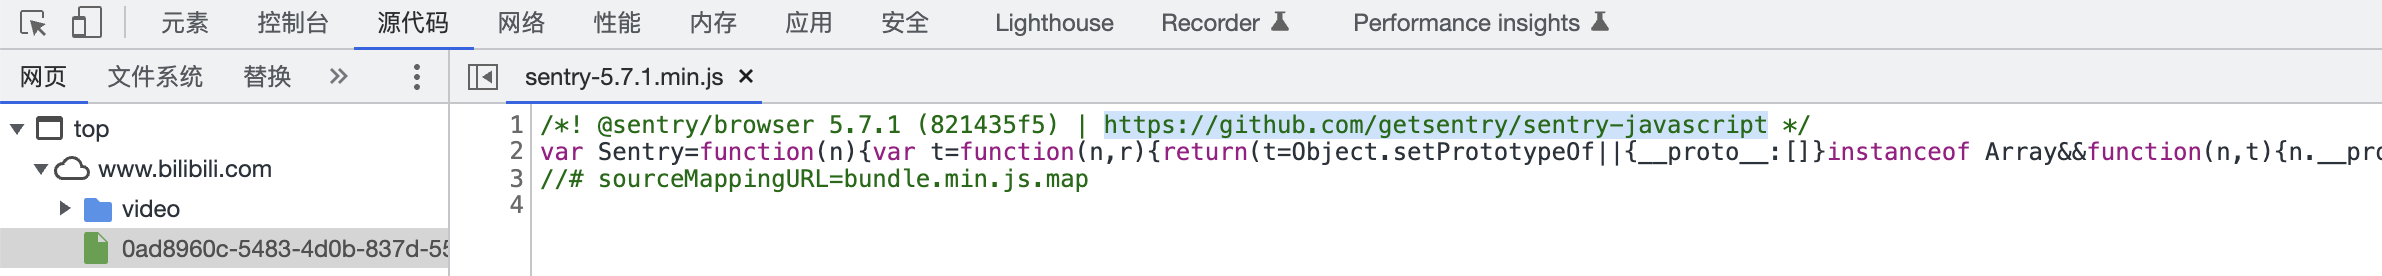
bilibili也在H5使用了Sentry!不信我给你来个截图。
Sentry介绍
Sentry是属于SASS技术平台,接入不是很简单!可以使用官方的地址服务。
首先要去平台注册账号!不要使用Github去授权注册,先注册在去授权绑定登录即可!图片↓

超级好看是不是!
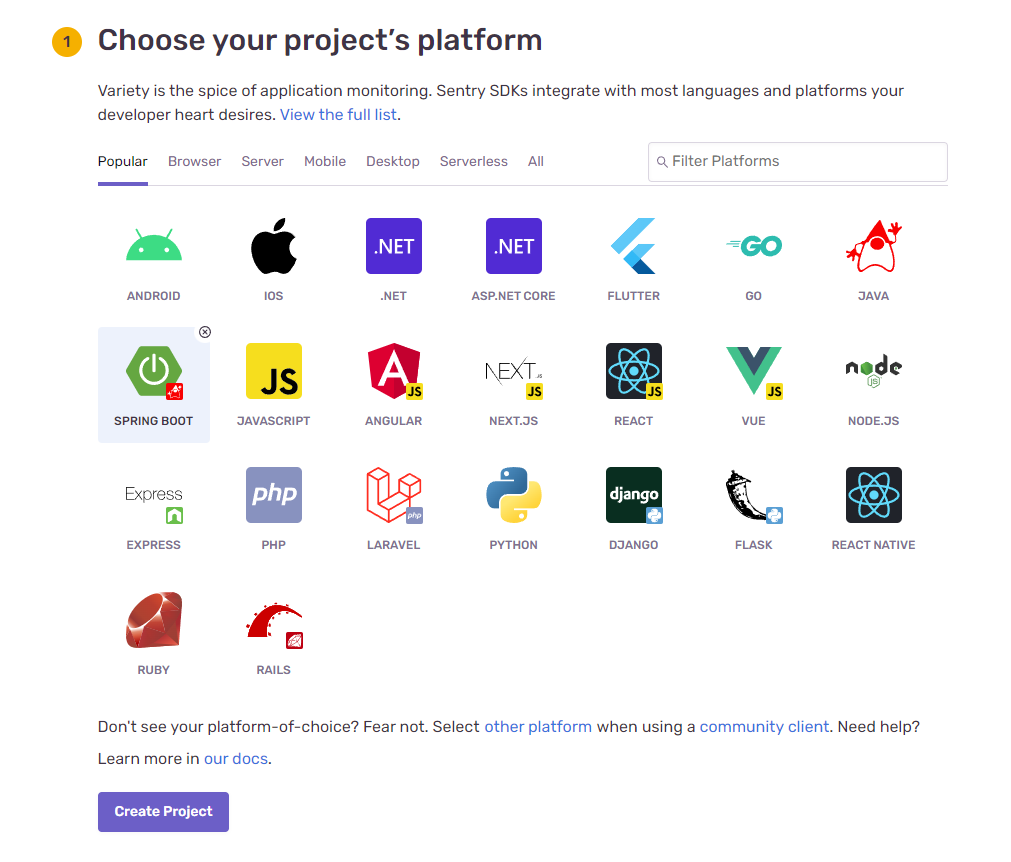
选择SpringBoot 在点击 Create Project 图片↓
这边会提示准备接入 SpringBoot SDK
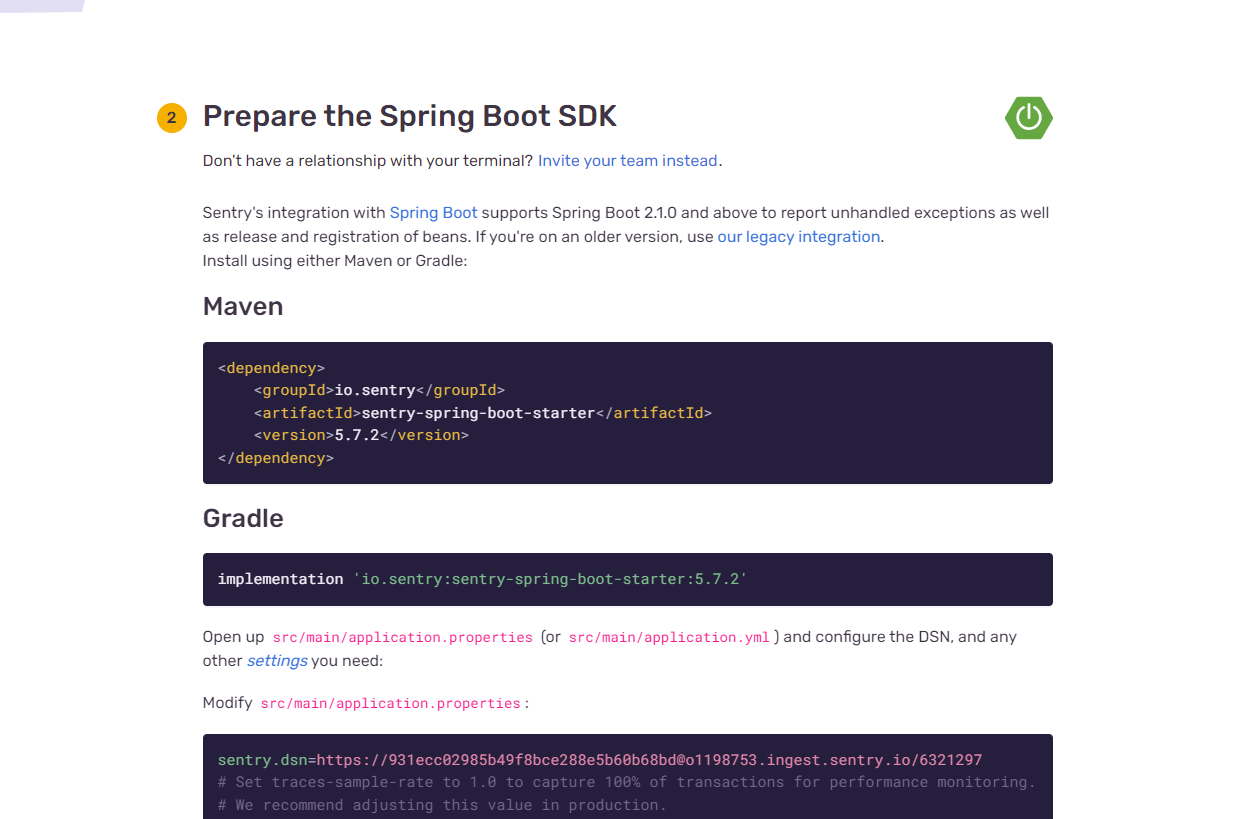
这里放上Sentry Maven依赖,方便你复制
        <!--Sentry 支持 Spring Boot 2.1.0 及以上版本-->
        <dependency>
            <groupId>io.sentry</groupId>
            <artifactId>sentry-spring-boot-starter</artifactId>
            <version>6.4.1</version>
        </dependency>
如果您使用 Logback 进行日志记录,您可能还希望将错误日志发送到 Sentry。加入下面Sentry集成的Logback的依赖
         <!-- Sentry Spring Boot Starter 将自动配置SentryAppender-->
        <dependency>
            <groupId>io.sentry</groupId>
            <artifactId>sentry-logback</artifactId>
            <version>6.4.1</version>
        </dependency>
<!-- Sentry依赖于GSON-->
<dependency>
<groupId>com.google.code.gson</groupId>
<artifactId>gson</artifactId>
<version>2.8.9</version>
</dependency>
除此之外,我们需要开启sentry的Debug模式,服务器没收到我们报错信息,我们都不知道是哪里的问题!!!!配置文件(application.properties)需要配置Sentry服务器DSN地址。我们用官方提供给我们的!如果是微服务,每个子服务都要加如下配置!
第一次接触Sentry务必开启Debug模式,在我第一次调试的时候,竟然不提供我有效的配置、以及其他项目依赖说明!导致Sentry看不到异常且报错无法查询信息!
# 接入Sentry
# 1、开启Debug模式,可以快速知道我们异常有没有被捕捉
#sentry.debug=true
# 2、配置DSN 也就是服务器的地址
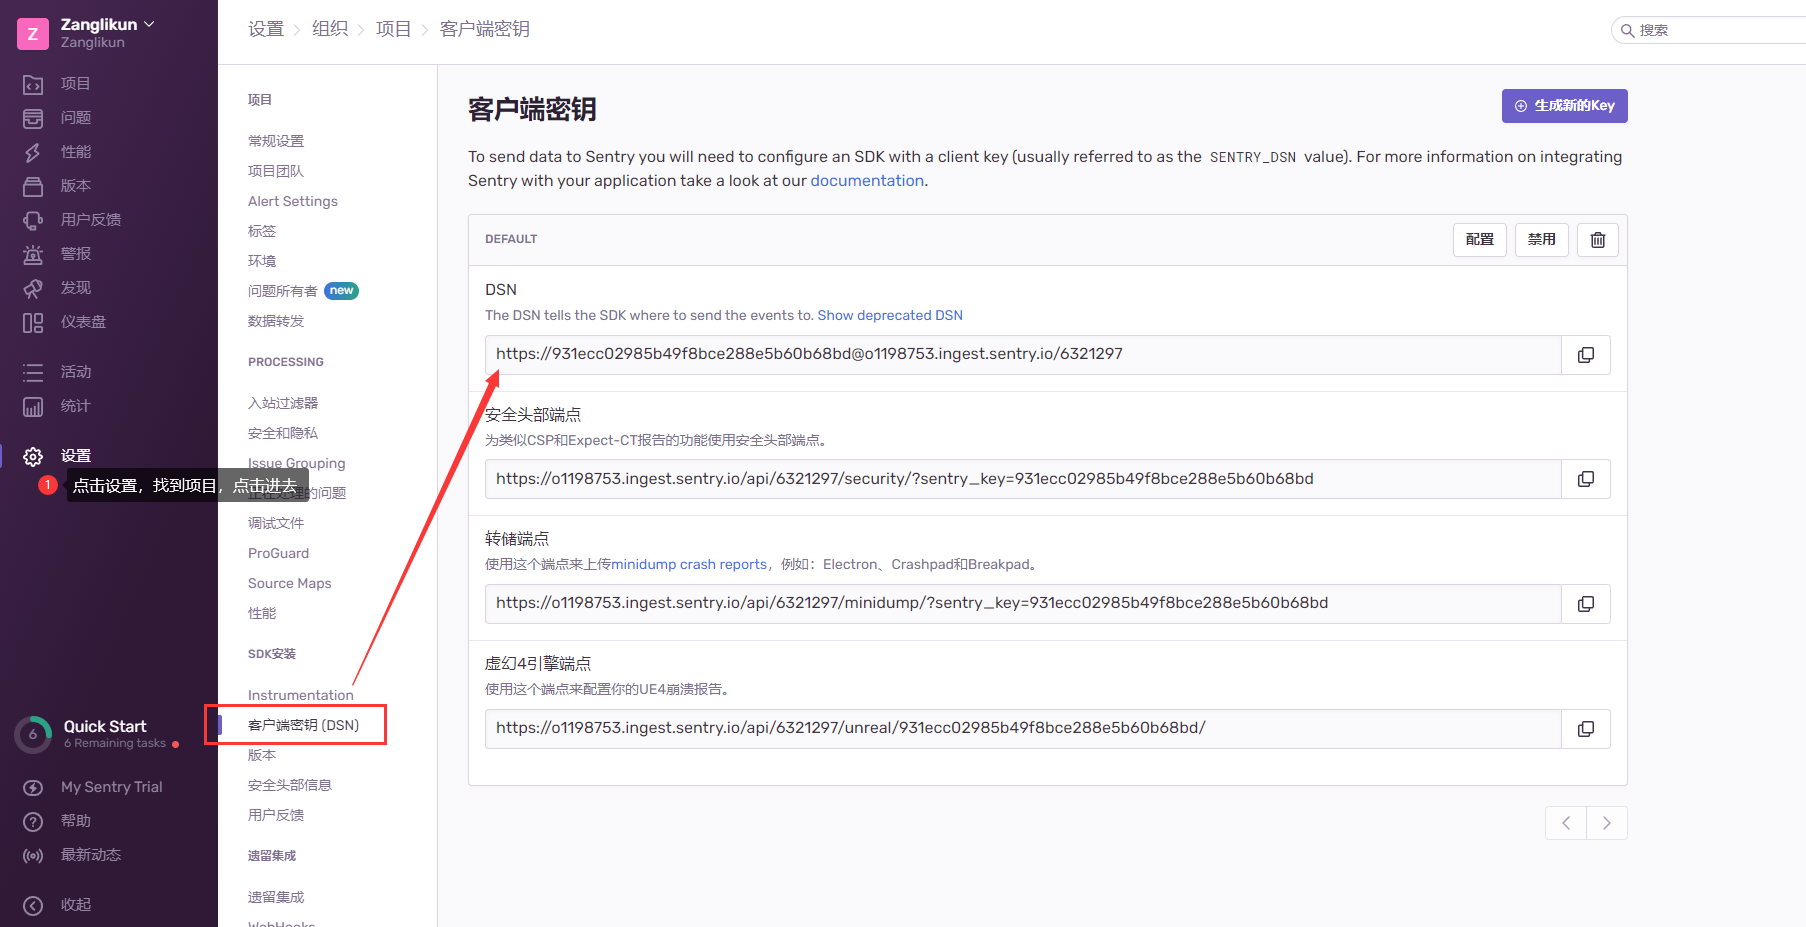
sentry.dsn=https://931ecc02985b49f8bce288e5b60b68bd@o1198753.ingest.sentry.io/6321297
# Set traces-sample-rate to 1.0 to capture 100% of transactions for performance monitoring.
# We recommend adjusting this value in production.
# 3、事务以进行性能监控:1.0就是100%去捕捉。
sentry.traces-sample-rate=1.0下面放2个Demo
Demo1
然后创建一个故意错误,您可以使用 Java测试
import java.lang.Exception;
import io.sentry.Sentry;

    @Scheduled(cron = "0/5 * * * * ?")
    public void ExecClearGC1() {
        try {
            throw new Exception("Sentry.captureException(e)捕捉到的异常");
        } catch (Exception e) {
            Sentry.captureException(e);
        }
    }
Demo2
每个传入的 Spring MVC HTTP 请求都会自动变成一个事务。要围绕 bean 方法执行创建 span,请使用注释对 bean 方法进行@SentrySpan注释:
import org.springframework.stereotype.Component;
import io.sentry.spring.tracing.SentrySpan;

@Component
class PersonService {

  @SentrySpan
  Person findById(Long id) {
    ...
  }
}
回归正题,创建了项目,我没得去配置Sentry错误采集地址,这个也就是我们需要自己项目接入的内容。
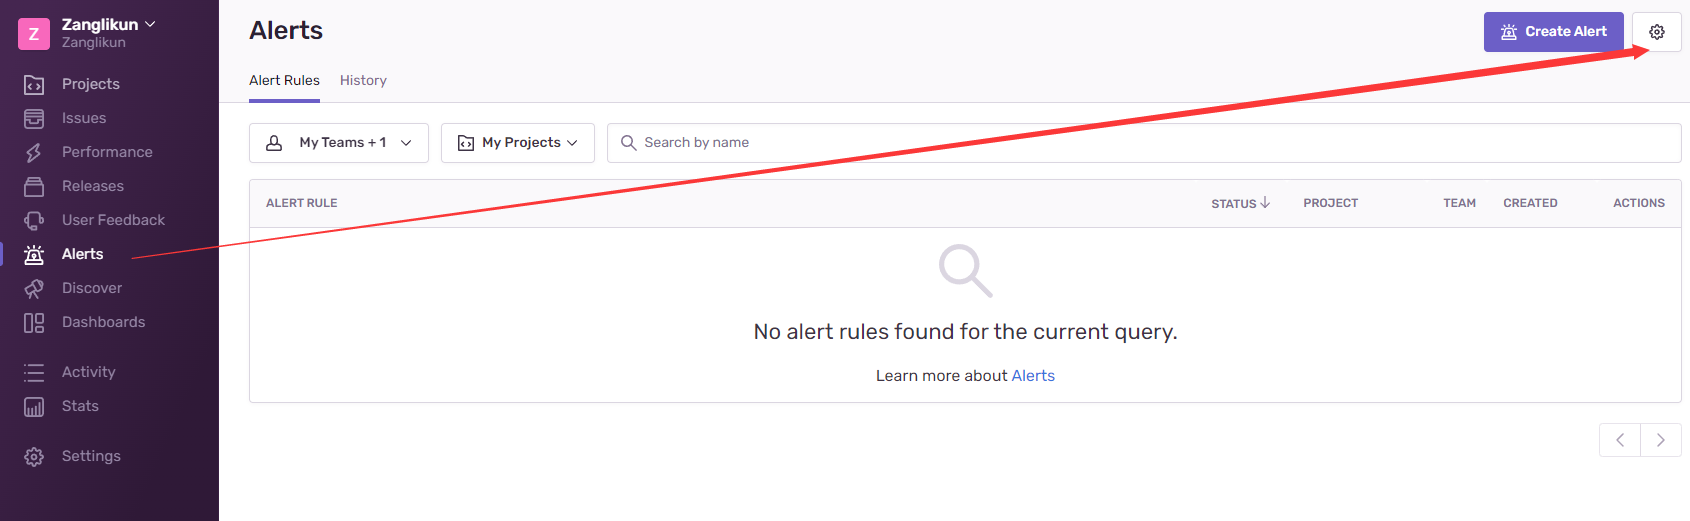
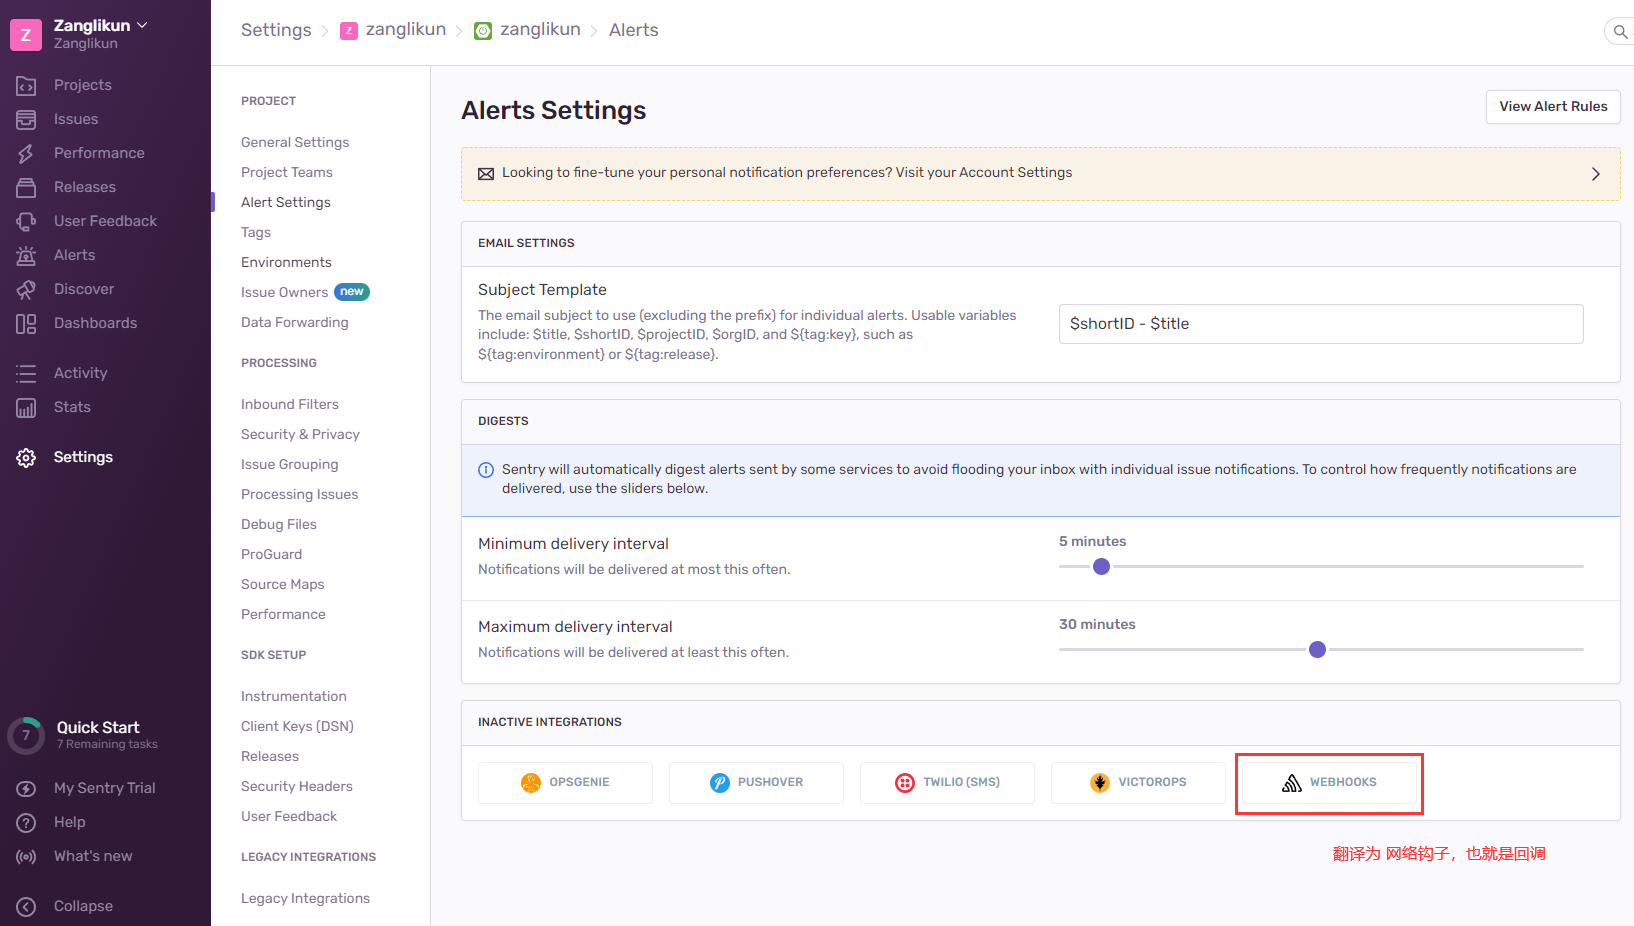
我们设定总告警服务!
创建自己的 网络钩子 回调
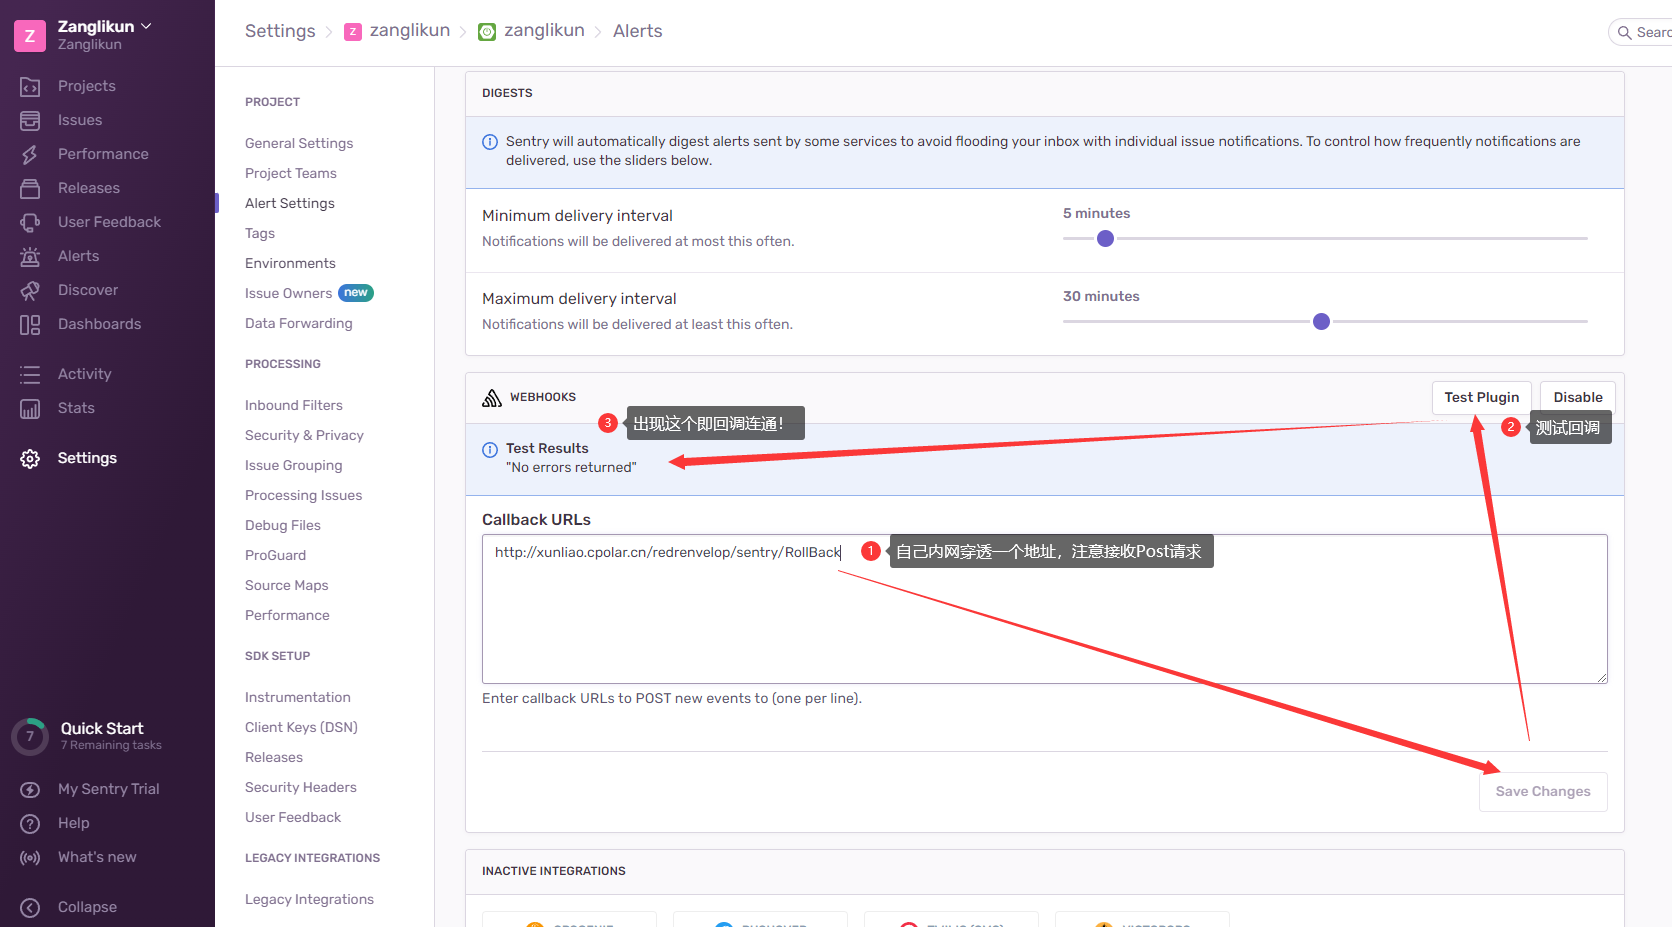
完事!
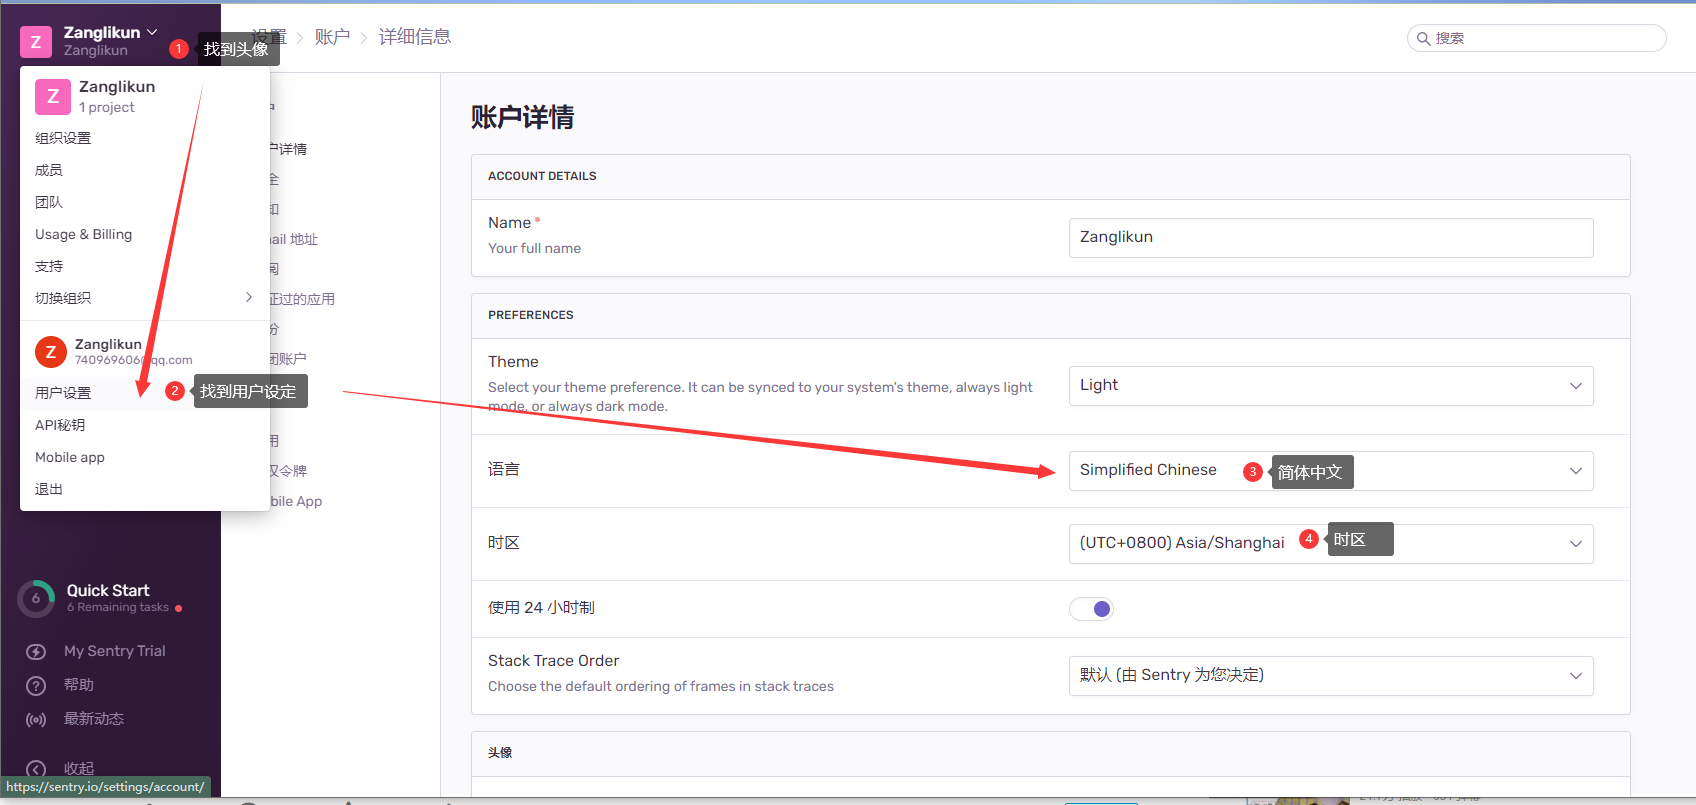
切换中文与时区
查找DSN 也就是 Clint Keys
特殊说明:
上述文章均是作者实际操作后产出。烦请各位,请勿直接盗用!转载记得标注原文链接:www.zanglikun.com
第三方平台不会及时更新本文最新内容。如果发现本文资料不全,可访问本人的Java博客搜索:标题关键字。以获取最新全部资料 ❤
免责声明: 本站文章旨在总结学习互联网技术过程中的经验与见解。任何人不得将其用于违法或违规活动!所有违规内容均由个人自行承担,与作者无关。
第三方平台不会及时更新本文最新内容。如果发现本文资料不全,可访问本人的Java博客搜索:标题关键字。以获取最新全部资料 ❤
免责声明: 本站文章旨在总结学习互联网技术过程中的经验与见解。任何人不得将其用于违法或违规活动!所有违规内容均由个人自行承担,与作者无关。