

Arthas:https://github.com/alibaba/arthas/
官方文档:https://arthas.aliyun.com/doc/
官方基础教程:https://arthas.aliyun.com/doc/advanced-use.html#id2
特别说明:我曾在github下载的arthas 启动那个math-game.jar 不能jad与watch 我在官网去下载的反倒可以使用!
推荐官方Arthas-IDEA插件
插件官网:https://plugins.jetbrains.com/plugin/13581-arthas-idea
Atrhas 对比 Jmeter
因为相比较Jmeter与Arthas对比,Jmeter更像是DDoS工具,在一定情况上,Jmeter会把带宽耗尽,导致一些请求无法进入,进而影响接口压力测试的结果!
快速入手
1、从官网Github下载发行版,就完事了。本质是一个jar包
2、启动 java -jar arthas-boot.jar 如果端口被占用 请追加参数 --telnet-port 9998 --http-port -1
或者使用 java -jar arthas-client.jar 127.0.0.1 某个进程ID -c "stop"
 java -jar arthas-boot.jar

 或者开启 Web浏览器控制台

 java -jar arthas-boot.jar --telnet-port 9998 --http-port -1

 监听远程服务器追加参数 --target-ip 即可
3、输入控制台打印的Java进程的序号
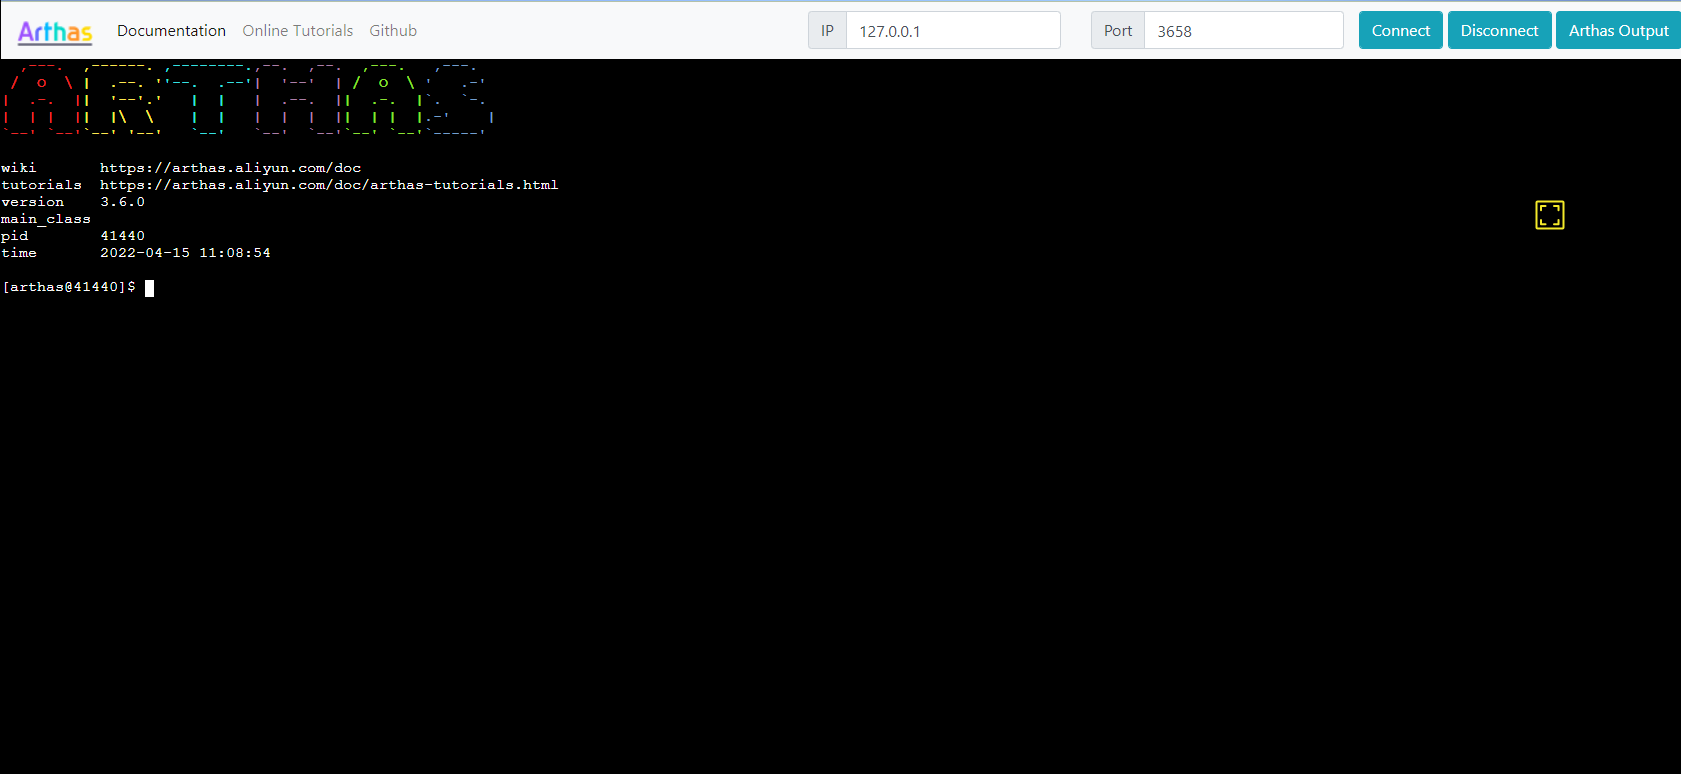
4、看到彩色的 banner ARTHAS 就启动成功了!
5、为了更好的体验,Arthas有自己的Web服务:默认:127.0.0.1:3658、 127.0.0.1:9998 即可看到web服务了
命令介绍
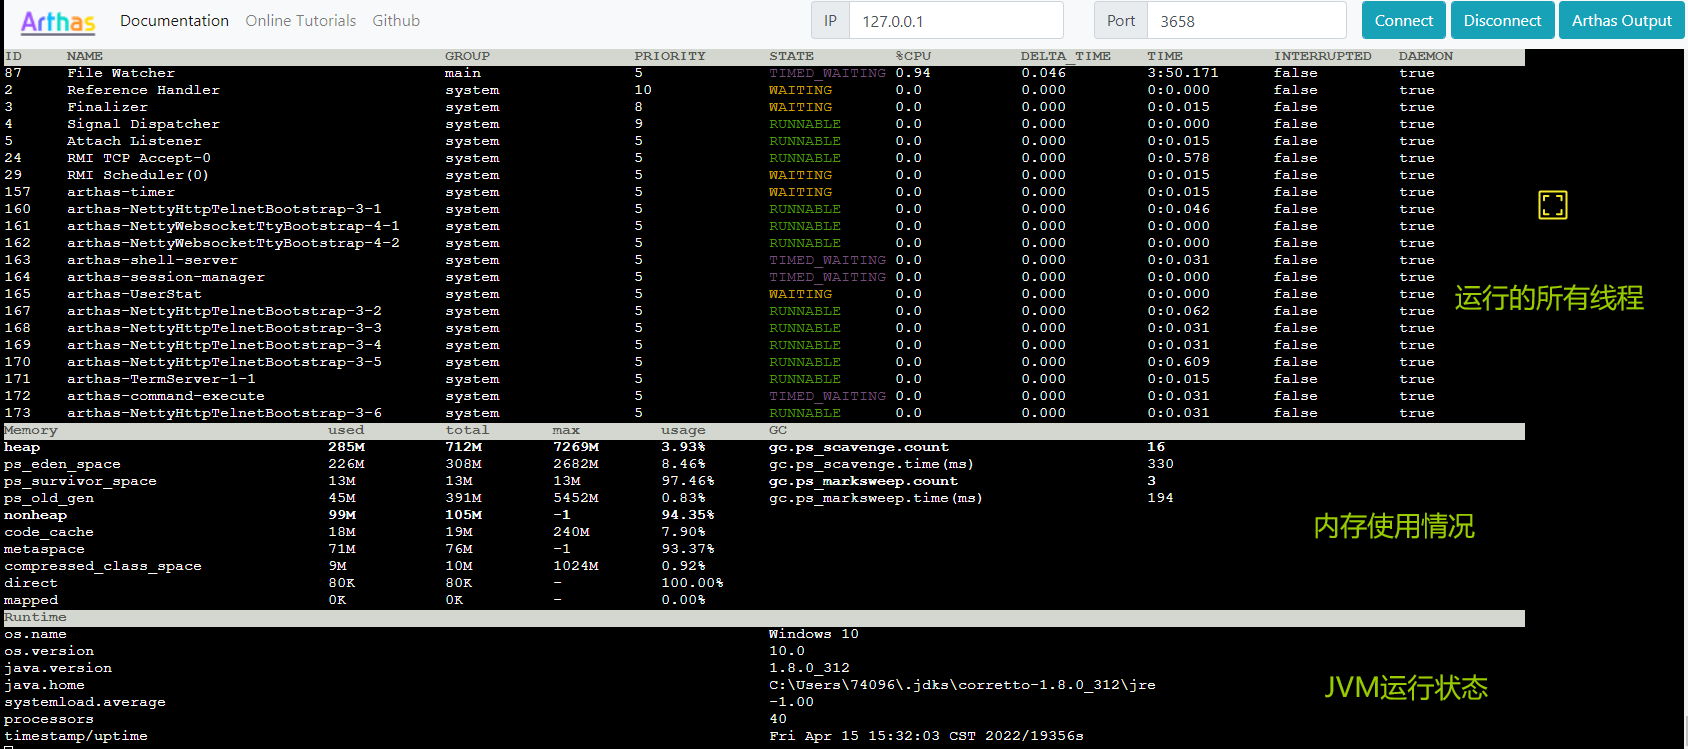
Dashboard 仪表盘
在控制台输入:dash + Tab键 自动补全 或直接输入 dashboard
如果要退出 按q 或者 Ctrl + C
memory 内存详情
【示例】查看JVM内存情况,此命令无参数可用
memory
[arthas@54683]$ memory Memory used total max usage heap 247M 860M 3641M 6.80% ps_eden_space 142M 401M 1294M 11.00% ps_survivor_space 32M 33M 33M 99.99% ps_old_gen 72M 426M 2731M 2.64% nonheap 150M 159M -1 94.73% code_cache 20M 20M 128M 15.79% metaspace 116M 123M -1 94.11% compressed_class_space 13M 15M 1024M 1.37% direct 2M 2M - 100.00% mapped 536M 536M - 100.00%
vmoption 查看,更新 VM 诊断相关的参数
【示例】查看vm参数
vmoption

【示例】修改VM PrintGC 为True
vmoption PrintGC true
KEY VALUE ORIGIN WRITEABLE ---------------------------------------------------------------------------------------------------------- HeapDumpBeforeFullGC false DEFAULT true HeapDumpAfterFullGC false DEFAULT true HeapDumpOnOutOfMemoryErro false DEFAULT true r HeapDumpPath DEFAULT true CMSAbortablePrecleanWaitM 100 DEFAULT true illis CMSWaitDuration 2000 DEFAULT true CMSTriggerInterval -1 DEFAULT true PrintGC false DEFAULT true PrintGCDetails false DEFAULT true PrintGCDateStamps false DEFAULT true PrintGCTimeStamps false DEFAULT true PrintGCID false DEFAULT true PrintClassHistogramBefore false DEFAULT true FullGC PrintClassHistogramAfterF false DEFAULT true ullGC PrintClassHistogram false DEFAULT true MinHeapFreeRatio 0 DEFAULT true MaxHeapFreeRatio 100 DEFAULT true PrintConcurrentLocks false DEFAULT true
cls 清屏
将arthas的控制台清空。
Thread [ID] 命令
官网链接:https://arthas.aliyun.com/doc/thread.html
当你输入Thread 进入线程的Dashboard的时候,你可以使用Thread 线程id 来查看线程状态!
如:

常用如下:
thread 显示所有线程的信息;
thread 线程ID 显示线程某线程ID的信息;
thread -n 5 显示当前最忙的5个线程打印;
thread -b 显示堵塞其他线程的线程;
thread -n 5 -i 1000 显示当前最忙的5个线程打印,采样时间间隔为1秒;
thread -state WAITING 显示指定WAITING 状态的线程。
Jad 反编译已经加载类的源码
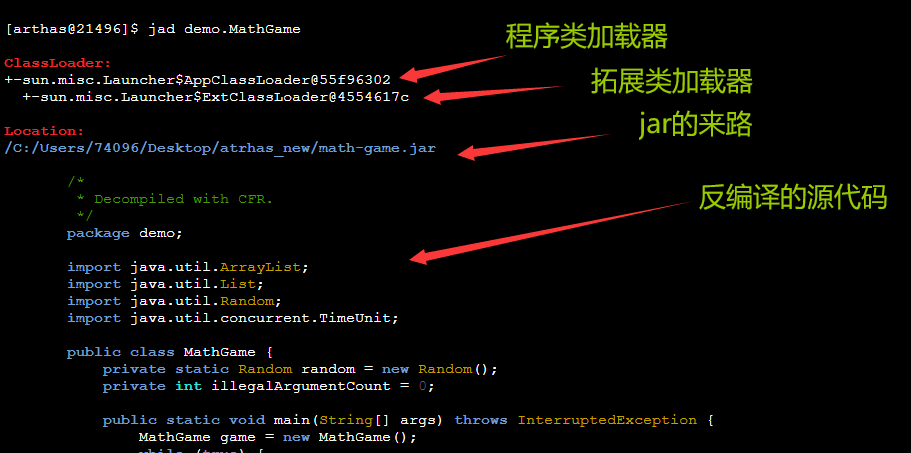
# 测试demo
jad demo.MathGame.jar

# 查看String的源码
jad java.lang.String
Watch 监视工具 - 查看方法参数就用这玩意
官网链接:https://arthas.aliyun.com/doc/watch.html
【示例】:查看UserController sayhello方法的入参、出参、异常情况,
watch com.zanglikun.springdataredisdemo.controller.UserController sayhello '{params,returnObj,throwExp}'  -n 5  -x 3
参数说明:-n表示watch的次数。-x表示遍历深度,最大值是4(就是数值越大,展示的信息越丰富)
触发时机参数:
| -b | 在函数调用之前观察 |
| -e | 在函数异常之后观察 |
| -s | 在函数返回之后观察 |
| -f 这是默认的 | 在函数结束之后(正常返回和异常返回)观察 |
redefine 热部署
官方链接:https://arthas.aliyun.com/doc/redefine.html
官方说:redefine命令不能修改、添加、删除类的 field 和 method,包括方法参数、方法名称及返回值。redefine 后的原来的类不能恢复,redefine 有可能失败(比如增加了新的 field)。
使用命令格式:redefine 新的字节码文件
像字节码文件我们可以从:javac 然后制定类名就行了,但是我们是spring,引用的其他依赖太多了。所以javac往往容易失败。我们可以在IDEA编译后,去target/classes中去找到我们最新的字节码文件
【示例】重新部署UserController字节码文件
redefine /Users/zanglikun/dev/code/spring-data-redis-demo/target/classes/com/zanglikun/springdataredisdemo/controller/UserController.class
monitor 统计监控
官网链接:https://arthas.aliyun.com/doc/monitor.html
【示例】监控UserController sayhello方法:10秒内统计项信息,循环10次
monitor com.zanglikun.springdataredisdemo.controller.UserController sayhello  -n 10  --cycle 10
用来监控单位时间的监控内容,如下:
| 监控项 | 说明 |
|---|---|
| timestamp | 时间戳 |
| class | Java 类 |
| method | 方法(构造方法、普通方法) |
| total | 调用次数 |
| success | 成功次数 |
| fail | 失败次数 |
| rt | 平均 RT |
| fail-rate | 失败率 |
stack:输出当前方法被调用的调用路径
官网链接:https://arthas.aliyun.com/doc/stack.html
这个我认为暂时用处不大,就不在说明了。异常会打印调用路径的
第三方平台不会及时更新本文最新内容。如果发现本文资料不全,可访问本人的Java博客搜索:标题关键字。以获取最新全部资料 ❤
免责声明: 本站文章旨在总结学习互联网技术过程中的经验与见解。任何人不得将其用于违法或违规活动!所有违规内容均由个人自行承担,与作者无关。