
Grafana是什么?
Grafana是一个开源的数据可视化平台,支持接入很多主流的数据库 如Mysql、Redis、ElasticSearch、Oracle等。可以快速查询和可视化相关数据库的信息!也可以告警相关服务!
Windows安装
下载地址:https://grafana.com/grafana/download
常规安装即可!
安装完成后,复制一份配置文件 命名为 consumer.ini 然后修改其配置文件
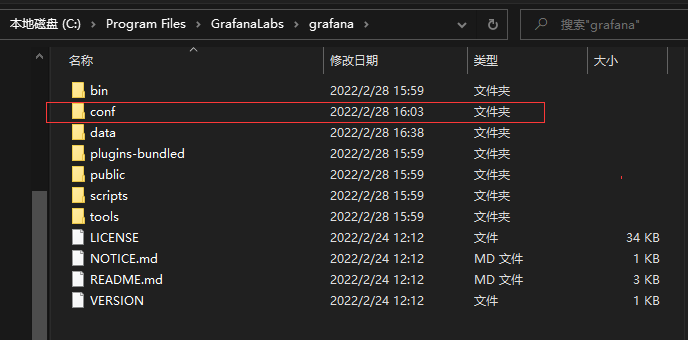
配置文件内容节选:
特别说明:配置文件是.ini,其注释是分号 ;
服务server
[server]
# Protocol (http, https, h2, socket)
;protocol = http

# The ip address to bind to, empty will bind to all interfaces
;http_addr =

# The http port to use 页面使用的端口号,修改保存后,重启即生效!
http_port = 18080
权限 security 也就是登录时,需要账号 ,账号密码都是admin
[security]
# disable creation of admin user on first start of grafana
;disable_initial_admin_creation = false

# default admin user, created on startup 默认就是admin
admin_user = admin

# default admin password, can be changed before first start of grafana,  or in profile settings 默认就是admin
admin_password = admin
重启后生效!
UI界面:127.0.0.1:你设定的端口 然后输入账号密码即可进入!
英文:
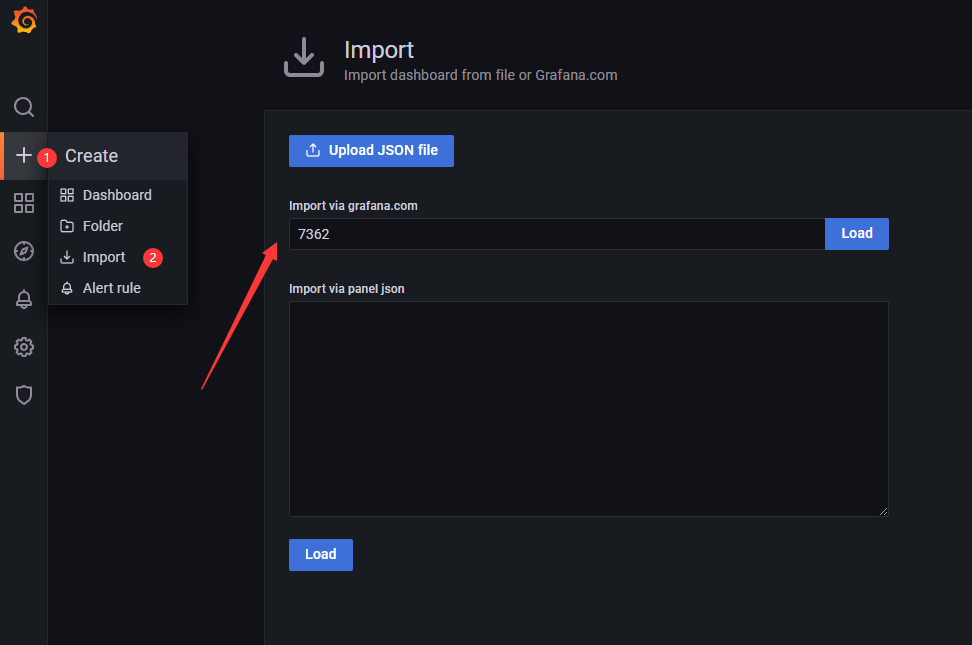
Dashboards:仪表盘
去配置自己的仪表盘
https://grafana.com/grafana/dashboards/ 找到ID
然后
特殊说明:
上述文章均是作者实际操作后产出。烦请各位,请勿直接盗用!转载记得标注原文链接:www.zanglikun.com
第三方平台不会及时更新本文最新内容。如果发现本文资料不全,可访问本人的Java博客搜索:标题关键字。以获取最新全部资料 ❤
免责声明: 本站文章旨在总结学习互联网技术过程中的经验与见解。任何人不得将其用于违法或违规活动!所有违规内容均由个人自行承担,与作者无关。
第三方平台不会及时更新本文最新内容。如果发现本文资料不全,可访问本人的Java博客搜索:标题关键字。以获取最新全部资料 ❤
免责声明: 本站文章旨在总结学习互联网技术过程中的经验与见解。任何人不得将其用于违法或违规活动!所有违规内容均由个人自行承担,与作者无关。